
Do you know what makes your email marketing successful? Which strategies work best to increase your revenue?
Understanding email marketing analytics is the key to understanding your performance and ensuring future growth.
Imagine having the power to predict your email performance before sending a campaign.
Actually, you don’t need to imagine it because monitoring your email marketing KPIs provides you with insights to help optimize your campaigns.
To help you focus on what metrics matter the most, in this article, you’ll learn:
- Why you need email marketing analytics
- 10 email marketing metrics you must track
- How to use email marketing analytics to create strategies
- Whether you need dedicated email analytics tools or not
Why you Need Email Marketing Analytics
1. Understand what makes sense
After launching an email campaign you must monitor your KPIs.
In email marketing, you’ve put the effort and the time into sending email campaigns.
Was it worth it?
That’s the question your email marketing measurement answers.
Email marketing analytics allows you to understand what makes sense in your email strategy. You’ll find out:
- What email campaign works best for you
- What to avoid in the next campaign
- If you’re getting closer to your business objectives
- If email marketing is worth the investment
A deep look into email KPIs is informative and tells you if you’re on the right track or not.
2. See what works and what doesn’t
Those who don’t look at their email analytics after each campaign are at risk of wasting their resources.
The risk is that you’re putting money, time, and effort into something without understanding if it worked or not.
Maintaining a routine of analyzing your email KPIs tells you:
- What to campaigns to keep sending
- What to campaign to stop
Eventually, you’ll be using your resources on sending campaigns that perform.
Why put hours of work on something that doesn’t benefit your business?
Make email marketing KPI review a regular and mandatory part of your email marketing process.
3. Learn about your contacts
Email marketing data is so informative if you look at it the right way. I’ll show you how.
Let’s start with the basics. Your contacts are different, they share different interests and have different expectations.
By not keeping an eye on your email campaigns’ metrics, you risk not understanding your audience.
This can lead to a sad ending where you send emails that don’t interest them, and eventually, they unsubscribe.
Here is a sad email marketing scenario that you can avoid.
Take an example of an email marketer who runs email marketing campaigns for a dentist. Let’s call him Steve.
The first campaign Steve sends includes 2 links, one for a teeth whitening offer, the second for mouth gum-care.
The link for teeth whitening gets 60 clicks, while the mouth gum care gets only 10 clicks.
Steve didn’t look at the performance of the sent campaign. One week later, he sends a second campaign with a discount offer for mouth gum-care.
Was that the right campaign to send? Absolutely not.
The moral of the story, if Steve looked at his email campaign analytics he could’ve known that the majority of his contacts are interested in teeth whitening and would’ve sent the right campaign next.
Too late, anyway.
Ignoring your email campaign analytics can cost you customers and leave you blind, deaf, in the middle of the freeway.
Once you understand your email reports, you learn more about your contacts, and by the end know what campaign to send next.
10 Email Marketing Metrics you Must Track
Let’s take a look at the email marketing metrics you should be paying attention to. We’ll cover the 10 most important metrics every email marketer should be tracking.
1. Email deliverability rate
Email deliverability is the ability to deliver emails to subscribers’ inboxes.
You can calculate your email delivery rates by dividing the number of emails sent minus bounces by the number of emails sent.
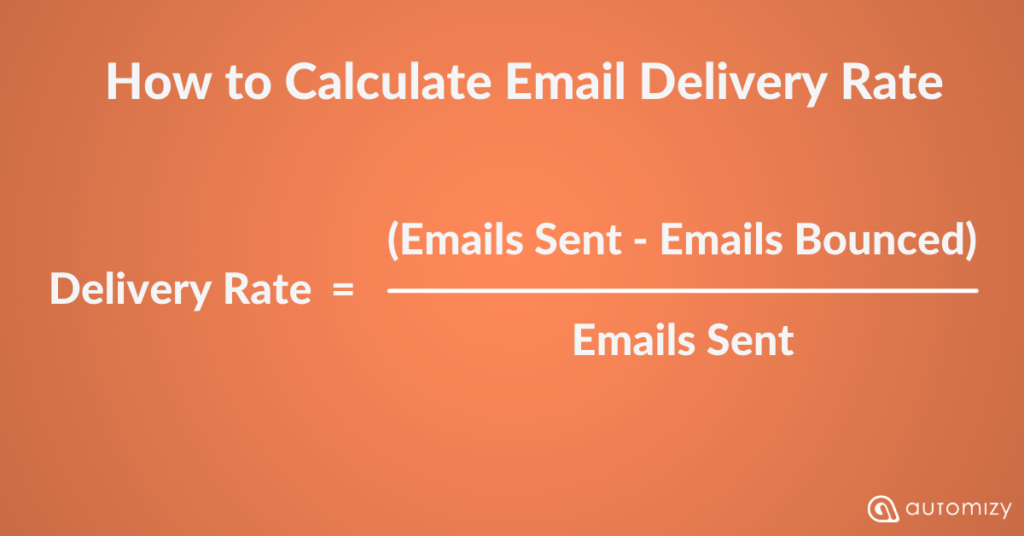
The number of sent emails won’t be the same as the number of delivered emails because of soft and hard bounces.
You don’t need to calculate your deliverability rate manually.
Automizy’s email software can accurately measure your delivery rates to know how many emails are sent successfully and how many bounce.
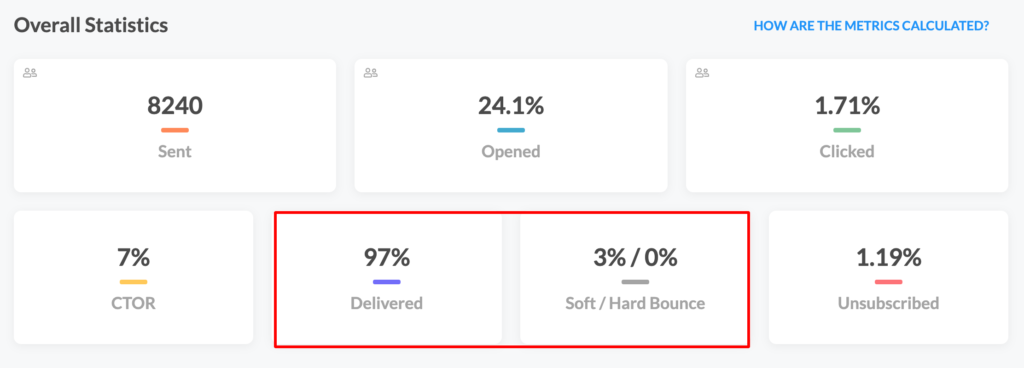
Email deliverability rate is among the top email metrics because it shows at what rate you’re hitting the inbox of your contacts.
2. Email bounce rate
A bounced email is an email that is rejected by a recipient’s mail server and gets bounced back.
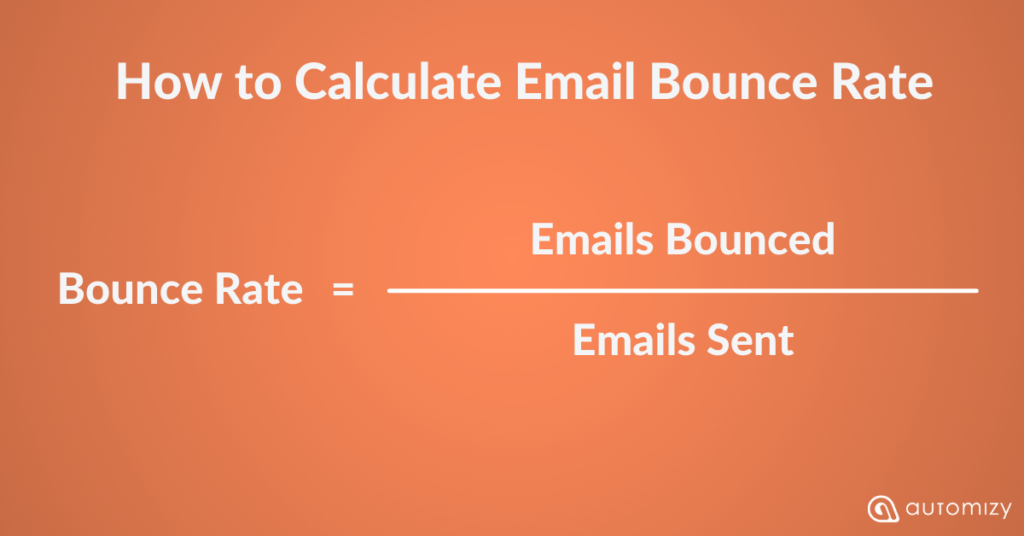
In other words, when an email is bounced and couldn’t reach the intended recipient, it gets returned to the sender as a notification with the bounce reason.
Once an email gets rejected by an email server, it’s called a bounce.
The lower your bounce rate is, the higher is your email deliverability.
As a part of email marketing metrics, you have to monitor your email bounce percentage to make sure that your emails are reaching your contacts.
Based on the bounce reasons, there are two types of email bounce:
- Soft bounce
- Hard bounce
A hard bounce in email marketing is the result of sending emails to recipients’ addresses that no longer exist.
Soft bounce in email marketing is a temporary delivery issue that is related to the receiving server. Might be a full inbox, email message too large, or recipient email server is down or offline.
Tracking bounces is important as it tells you about the quality of your contact list.
For instance, when you notice an increase in hard bounce rates, that’s a sign that you should clean your email list.
In Automizy, after an email gets 5 soft bounces it will change to hard bounce status and campaigns can no longer be sent to this email. So this part of the list cleaning is done for you automatically.
This is how you can make your email marketing analytics metrics informative. Each data or KPI gives you a sign of what action you have to make next.
3. Email open rate
Your email open rate is calculated by dividing the number of unique opens by the total number of emails sent, minus the number of bounced emails.
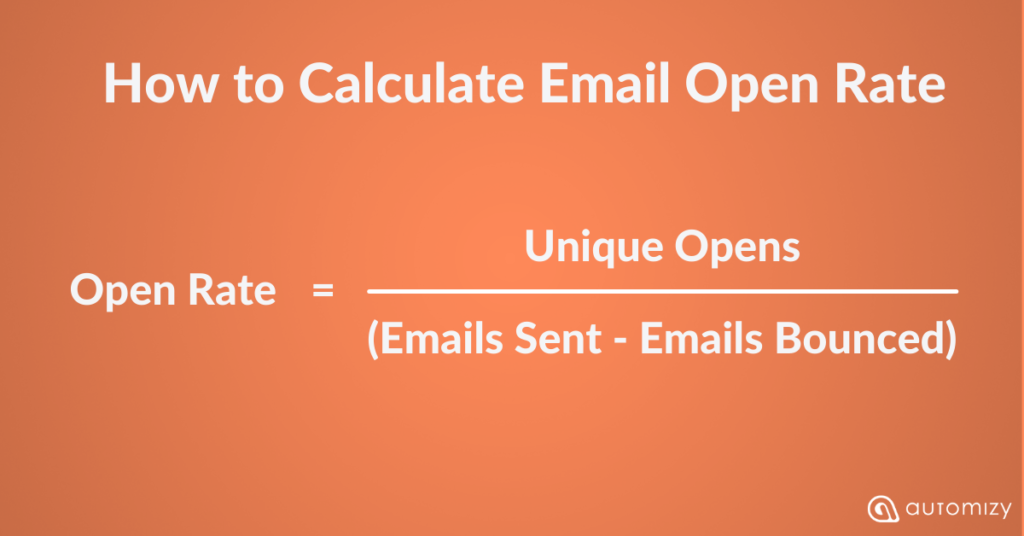
To put it simply, it’s the percentage of email recipients who open a given email.
Right after email deliverability, the open rate is among the top email KPIs to keep track of.
Opened emails get you clicks and conversions. Contacts who don’t open an email won’t even see what’s inside it to consider making an action or not.
Increasing your email open rates should always be a top priority for your email strategy. To increase your email open rates, consider:
- Resending emails to non-opener
- Testing email subject lines
- Personalizing subject lines
- AB testing
- Sending campaigns at the right time
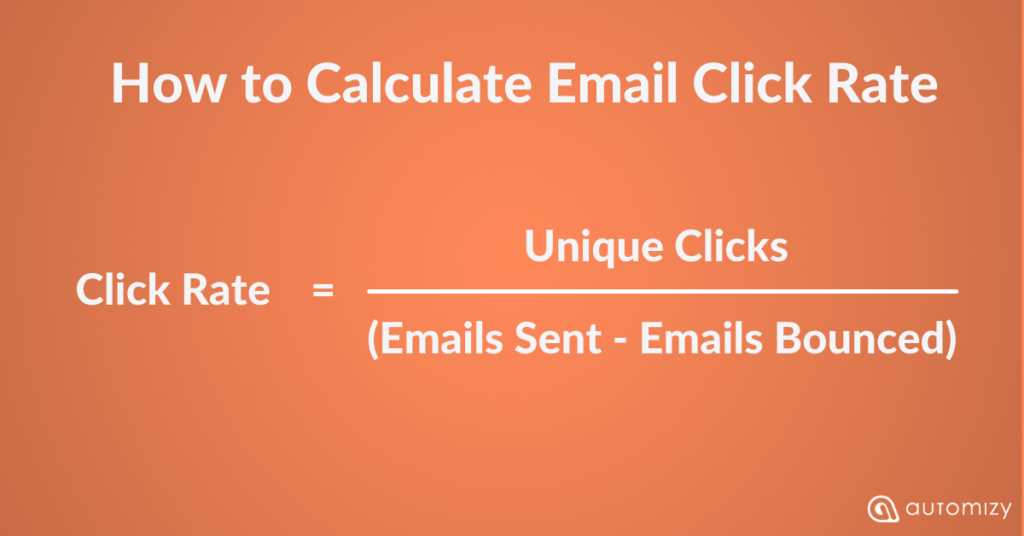
4. Email Click Rate & CTOR (Click-To-Open Rate)
The Click Rate simply measures how many emails resulted in a recipient clicking your link.
However, the Click-To-Open Rate (CTOR) measures what percentage of openers clicked a link in your email.
The clicks can be on:
- A text link,
- A button link,
- Or an image with a link within an email campaign.
Click Rate can be calculated by taking the number of clicks an email receives and dividing that by the number of delivered messages.
Click-To-Open Rate (CTOR) is calculated by dividing the number of clicks an email receives with the number opens.
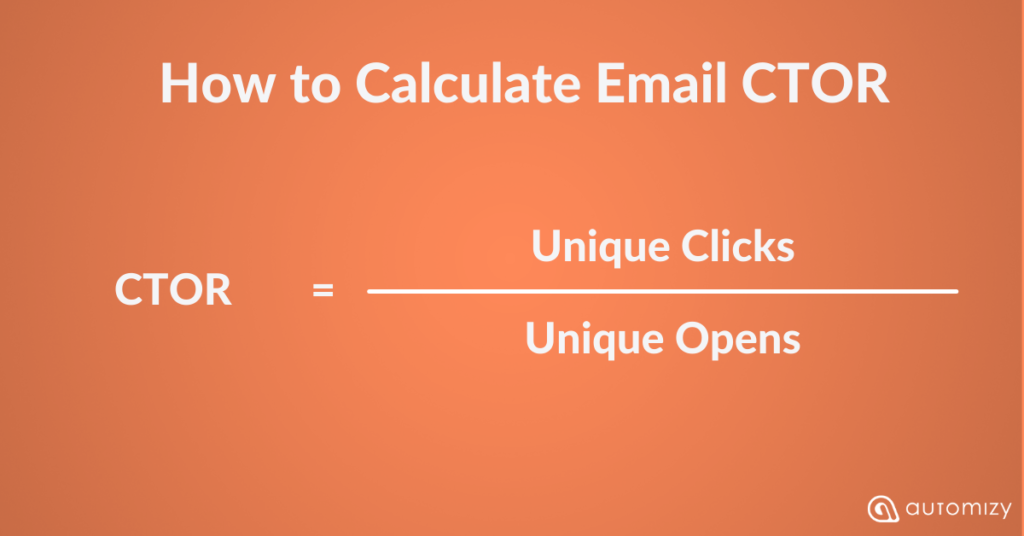
CTOR measures the effectiveness of your email copy and design, so it’s definitely an email metric you have to track constantly
To put it simply, it’s how many contacts take an action after they’ve opened your email campaign.
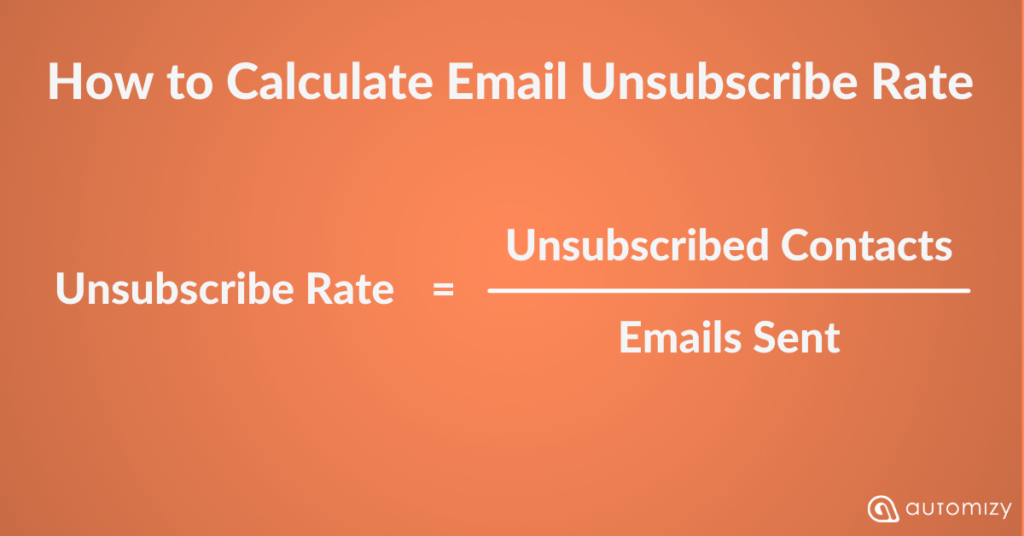
5. Unsubscribe rate
Unsubscribe rate is the percentage of contacts who have opted-out from the email list after an email campaign.
It’s calculated by dividing the number of unsubscribed contacts with the number of emails sent.
Higher email open rates are a positive signal for email clients like Gmail, Yahoo, and Outlook, while high unsubscribe rates are a negative signal.
So, it could harm your email deliverability rate.
To stay on the right side of unsubscribe rate, consider:
- Segmenting your contact list
- Personalizing your emails based on interests
- Optimizing the frequency of sent emails
6. Conversion rate
Email conversion rate is the percentage of email recipients who clicked on a link within an email and completed the desired action, such as:
- Filling out a registration form for an event
- Placing an order
- Watching a video
- Reading an article
It always depends on the objective of your email campaign.
You can calculate your conversion rate by dividing the number of people completing the desired action by the number of emails delivered.
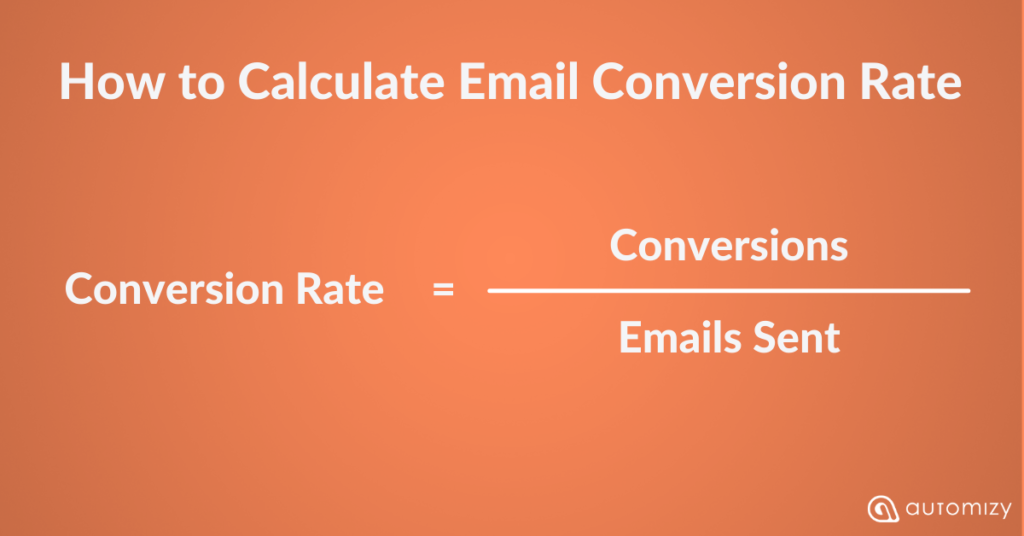
For example, if you send an event registration email to 1000 contacts and only 100 registers, your conversion rate is 10%.
Here is the process of getting to a conversion:
- The contact receives the email
- The contact opens the email
- The contact clicks on a link in the email
- The contact completes the desired action on the page
The conversion objective is tied to the call-to-action of your email.
Without a doubt, conversions are what you look at after every campaign you send. It’s one of the most important email metrics for determining the extent to which you’re achieving your goals.
To measure the conversion rate on your emails, you’ll need to use UTM parameters tool to create unique tracking URLs for your email links that identify the source of the click as coming from a specific email campaign.
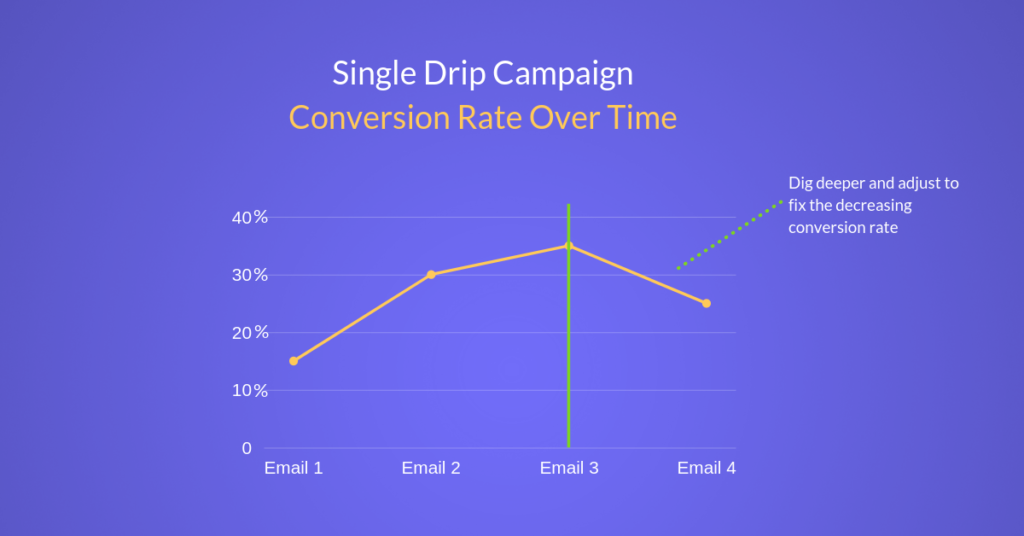
7. Conversion over time
Drip campaign conversions allow you to track the key milestones you want your subscribers to achieve.
Here is an example.
You set up a drip campaign with 4 emails offering your free trial.
In this case, you will have a conversion rate for each email. Naturally, when a lead achieves the goal he won’t receive the next emails.
Measuring the conversion of your email drip campaign helps you decide on how many emails you should send.
If contacts achieve your campaign’s goal from the first or second email, that means you managed to convert people.
Most importantly, keeping an eye on the conversion of each email of the drip sequences helps you understand what kind of emails convert the most.
8. End-to-end conversion rate over time
If conversion rate over time is the micro-conversion of each email of the drip campaign, your end-to-end conversion is the macro-conversion of your drip campaign as a whole.
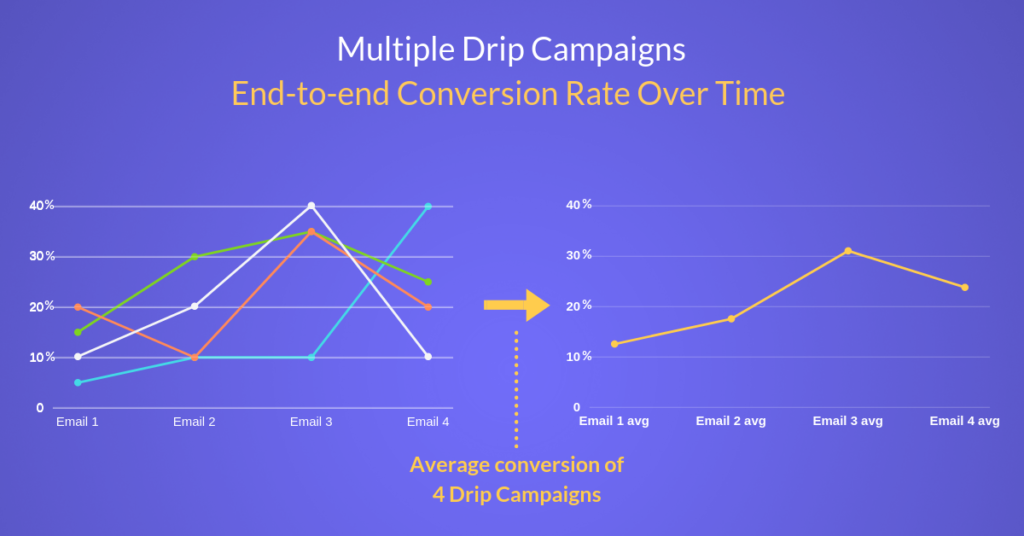
This means how many leads entered your drip campaign, and by the end of the drip campaign how many leads performed the desired action.
Every drip campaign has a level that represents the leads’ stage in the customer journey.
As you probably have more drip campaigns, you create email workflows for leads who are at different stages of the customer journey.
As a result, you will be able to create a “funnel view” which shows you the different conversion rates between stages.
End-to-end conversion rate over type is an important KPI to keep an eye on to understand better your email performance and identify bottlenecks.
9. Time to customer conversion
Time to customer conversion is the average length of closing a deal.
This will allow you to calculate the necessary time to convert a specific buyer persona that is in a defined stage of the sales funnel.
With marketing automation, you can continuously lower the necessary time by tracking this KPI and experimenting with your contents.
Time to customer conversion is an insightful email marketing metric. But don’t over-do it and try to make it as short as possible.
Some products simply have a longer sales cycle, or a longer time to ask customers to repeat a purchase.
Think of your optimal sales cycle length, compare it to your time to customer conversion to understand your email marketing performance.
10. Unsubscription rate over time
Every email drip campaign has an unsubscription rate, calculated by dividing the number of unsubscribes by the number of email subscribers.
This metric can show you which messages need to be sent another time and which not.
For example if sales messages are sent too soon, or which information is not good enough for leads at a specific stage of the funnel.
Unsubscription rate over time is an insightful email marketing KPI that you have to interpret in the right context.
It informs you on what action to take next to optimize your drip campaign.
It is possible that the messages you crafted for a specific drip campaign are good, but the segment is completely wrong. Which leads to high unsubscribe rates.
How to Use Email Marketing Analytics to Create Strategies
Your email marketing analytics can tell you what:
- Email design to use and send
- Content-type to share
For instance, if you notice higher engagement with plain text emails than a designed newsletter, you now know what design to use.
Also if emails that include videos generate more clicks then that’s the type of content you’d rather go with.
This is how your email marketing analytics helps you create email strategies.
Your email metrics are insights that you must constantly look at to spot growth opportunities.
Do you Need Dedicated Email Analytics Tools?
Nowadays you don’t need a separate email marketing analytics tool to analyze your campaigns.
For instance, Automizy email software provides you with dedicated email marketing reporting and analytics to help you understand your performance.
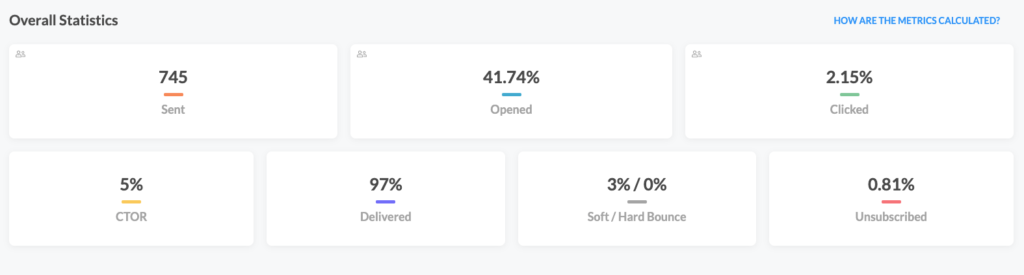
After sending a bulk email campaign, you can access an easy-to-understand dashboard to learn about your email performance.
The dashboard provides you with a report that includes:
- The number of Emails Sent
- Email Open Rate
- Email Click Rate
- CTOR (Click-To-Open Rate)
- Delivery Rate
- Soft and Hard Bounce Rates
- Unsubscribe Rate
If you AB test your email subject lines, you’ll have access to a dedicated dashboard to analyze your subject line variations’ performance.
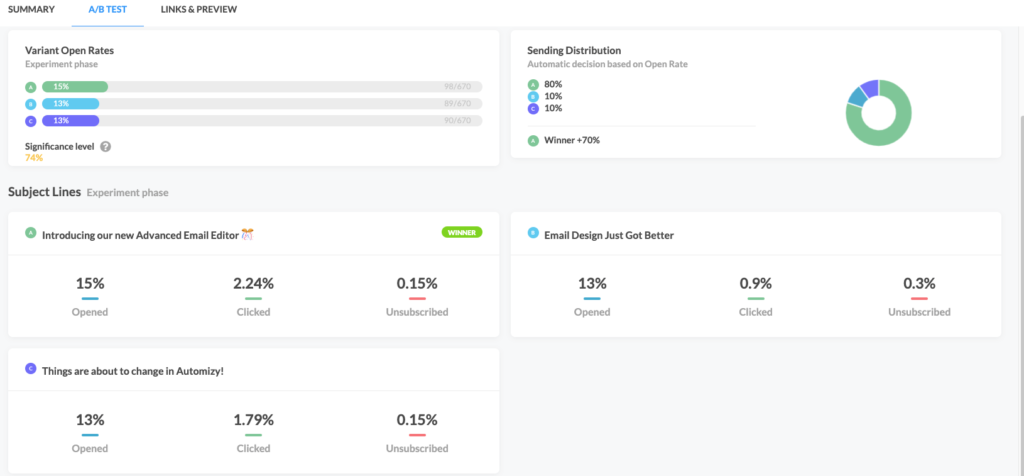
This informative dashboard allows you to understand what performed best, and what difference it made on your overall email campaign performance.
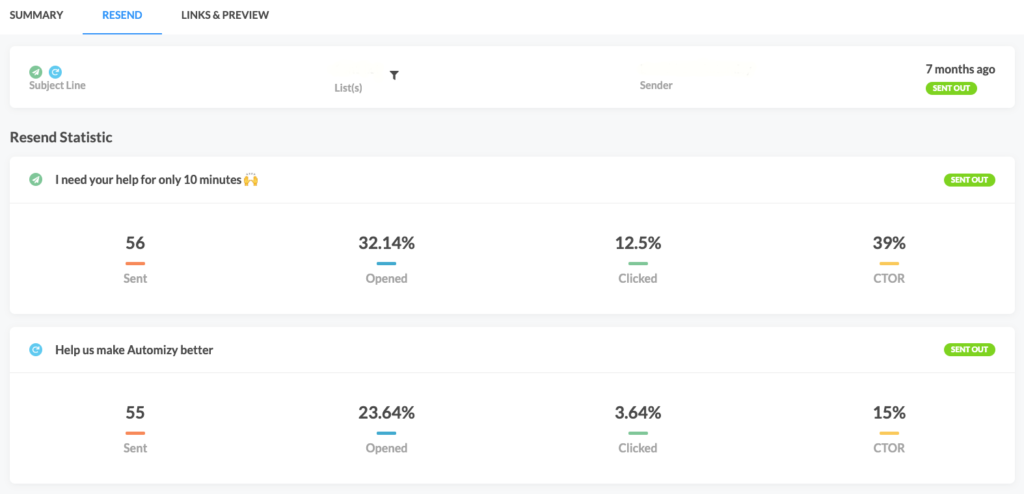
Automizy users who set up automated campaign resend to non-openers can see on the email campaign dashboard how the resend performed.
Sign up to Automizy to send campaigns and access an informative email dashboard to:
- Understand your performance
- Optimize future campaigns
Is email reporting limited to bulk emails only? No.
Automated emails and drip campaigns include reporting so you can understand how your contacts interact with automated emails.
For instance, if you set up a drip campaign that includes 5 emails on a 2 weeks timeline, you can easily tell how your emails perform over time.
How’s this useful?
When you notice your open rate decrease significantly at a certain step of your drip campaign you can easily notice it and fix it.
If your first 3 emails of the drip campaign score 30% open rate, and the fourth email gets 10% there must be something wrong.
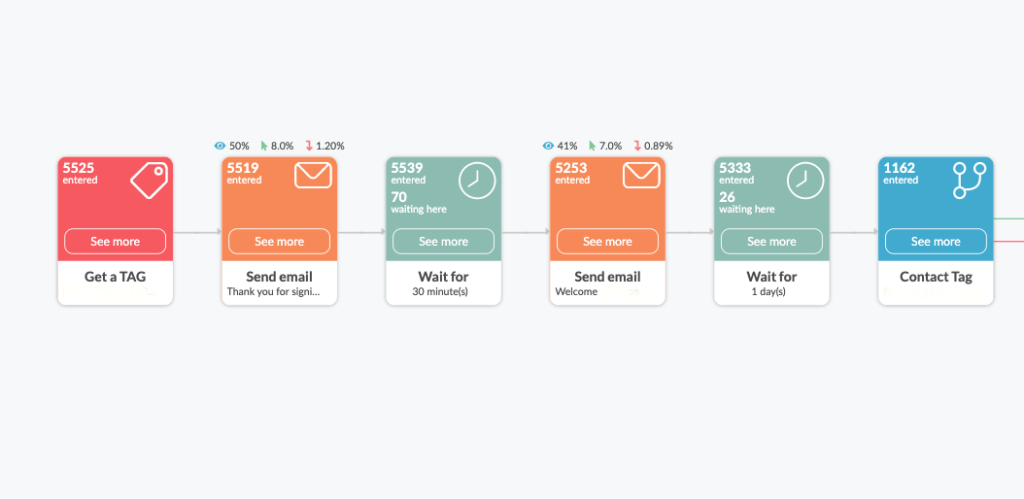
Automizy provides you with an overview of your automation analytics so you can spot exactly where your automation is leaking and optimize it.
Here is an email automation reporting example from a webinar email campaign.
Conclusion
“In data we trust.”
That’s the mindset you need to have or develop when running email marketing campaigns and executing strategies.
Looking at your email marketing analytics and metrics must be a routine task. It gives you:
- Insights on what works and what doesn’t
- Tell you what to do next
- Optimization opportunities to increase your performance
Optimizing your future campaigns based on your data can only lead to a happy ending. Better performance, higher revenue.